

The recently announced Google Visualization API have some interesting temporal examples in their gallery. From a technical perspective the widgets (or 'gadgets' as Google are calling them - everything begins with a G at Google) are built with either AJAX or Flash, and the data format of choice seems to be XML.
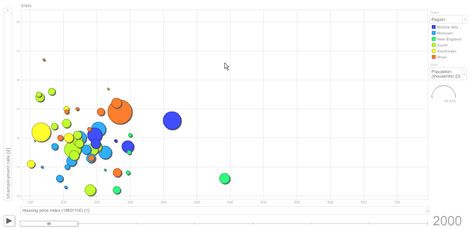
MotionChart (Flash)
If you have ever come across Hans Roslings work at GapMinder then you'll be familiar with this animated interactive way of visualising data over time. I'm very keen to implement this kind of interactivity in the Computus Engine for the exploration of natural cycles.
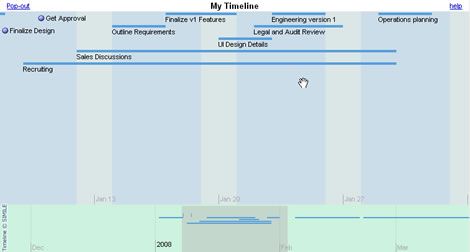
Timeline Gadget (AJAX)
The standard timeline visualisation is an implementation of the Simile Timeline. Moving the range selector in the bottom layer repositions the micro view in the top layer. I've looked at this previously here.
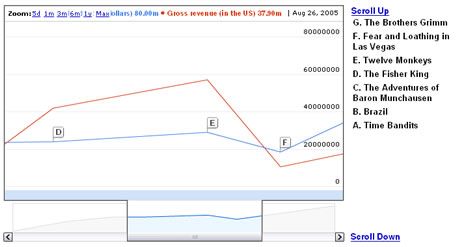
Time Series (Flash)
This one has a similar view to the Timeline Gadget but has slightly enhanced interaction. The lower timeline still represents the macro view but in this gadget the range selector can be sized as well as repositioned.
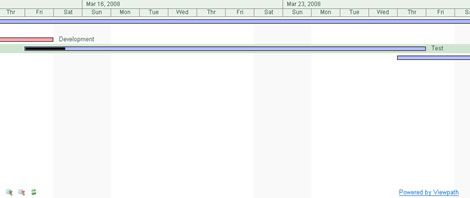
Gantt Chart (AJAX)
The Gantt chart takes project management data and renders task schedules using Name, Start, Finish, and optional Progress columns.


