

A synchronoptic timeline is one in which several timelines are displayed concurrently. The earliest recognised example dates from 1753 and is the work of the French physician Jacques Barbeu-Dubourg.
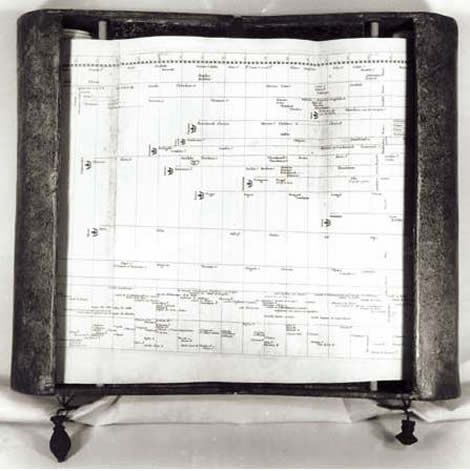
His Carte chronologique was produced on a scroll some 54 feet long, and at a scale of one year per tenth of an inch, it spanned the 6,480 years since the creation. Onto this Barbeu-Dubourg plotted a number of thematic timelines. Notable persons are annotated with iconography denoting their profession and social or religious status.
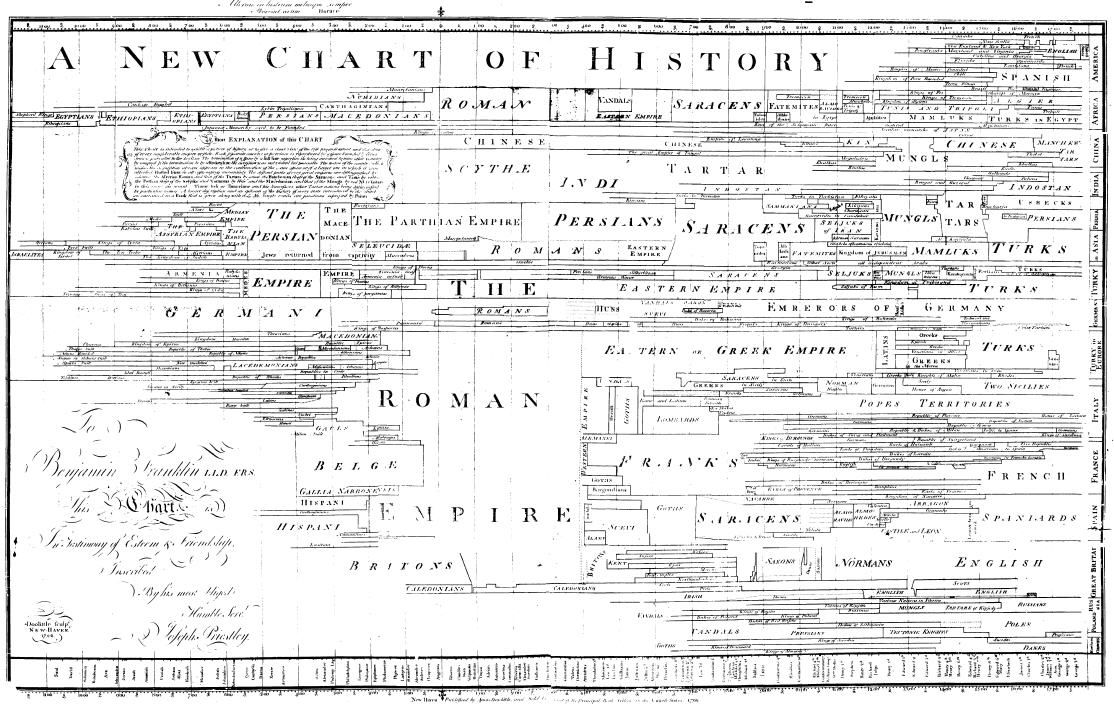
A contemporary of Barbeu-Dubourg was the English chemist Joseph Priestley who produced a number of synchronoptic timelines during his lifetime, including several editions of his New Chart of History.
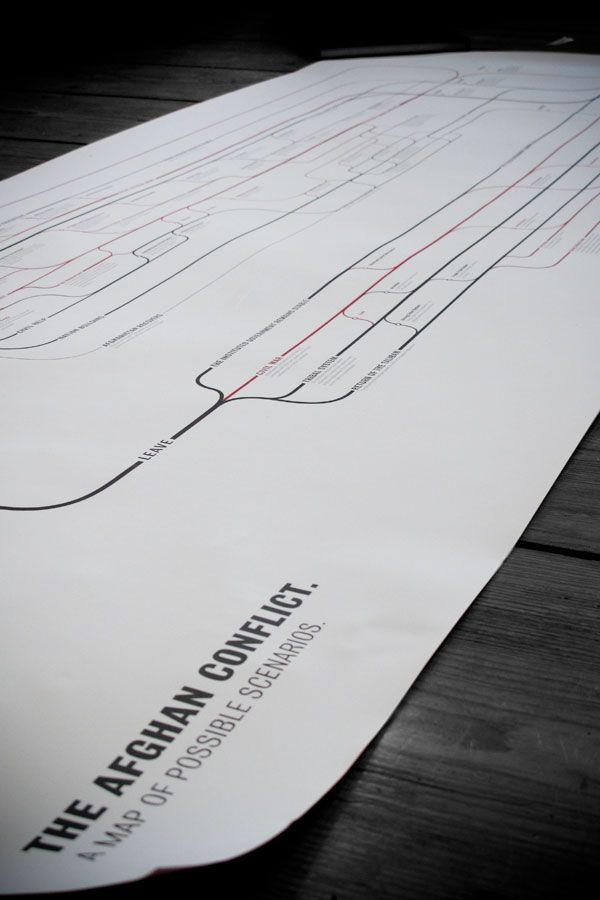
The Afghan Conflict: A map of possible scenarios offers a modern take on the synchronoptic timeline. Instead of documenting the past Marc Tiedemann has charted a number of possible futures for the Afghan Conflict. The scenario timeline is available as a 164cm x 70cm printed poster and also as an interactive presentation on Prezi.


